Update: New content about moldflow analysis now available. Please visit our blog, Moldflow Analysis for Injection Molding.
When using Injection Molding as a process to manufacture your part, many aspects impact whether or not your injection molded part can actually be produced. Factors may include Fill Time, Plastic Flow, Confidence of Fill, Quality Prediction, Orientation of Skin and Skin Marks, Air Traps, and Average Temperature. To produce your part with a higher level of confidence, mold flow analysis should be performed to insure the best manufacturability possible.
Fill Time
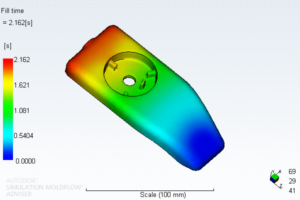
The Fill time result shows the position of the flow front at regular intervals as the cavity fills. The Fill time result is a different representation of the Plastic flow result.
Plastic Flow
The Plastic flow result is a different representation of the Fill time result. All regions with the same color are filled simultaneously. The result is dark blue at the start of the injection, and the last areas to fill are red.
Confidence of Fill
The Confidence of fill result displays the probability of plastic filling a region within the cavity under conventional injection molding conditions. This result is derived from the pressure and temperature results.
Quality Prediction
The Quality prediction result is used to estimate the quality of the mechanical properties and appearance of the part. This result is derived from the pressure, temperature, and other results.
Orientation at Skin
The Orientation at skin result provides a good indication of how molecules will be oriented on the outside of the part, showing the average principal alignment direction for the whole local area at the end of filling.
Average Temperature
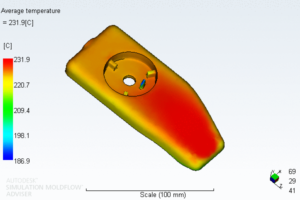
The Average temperature result shows the average bulk temperature through the thickness of the part at the end of fill. The temperature of polymer melt changes not only with time and location, but also with thickness during the entire injection molding cycle.
Air Traps
An air trap occurs where the melt traps and compresses a bubble of air or gas between two or more converging flow fronts, or between the flow front and the cavity wall. Typically, the result is a small hole or a blemish on the surface of the part.
Weld Lines
The Weld lines result displays the angle of convergence as two flow fronts meet. The presence of weld lines may indicate a structural weakness and/or a surface blemish. The term “weld line” is often used to mean both weld and meld lines.
Sink Marks Estimate
The Sink marks estimate result displays simulated sink marks on the part. The Sink marks estimate result displays the calculated depths of sink marks in the part and provides a legend to interpret the depth differences.
Read more detail about each analysis below including how each result should be used, and things to look for below…
Fill Time and Plastic Flow
The Fill time result shows the position of the flow front at regular intervals as the cavity fills. The Fill time result is a different representation of the Plastic flow result.
The Plastic flow result is a different representation of the Fill time result. All regions with the same color are filled simultaneously. The result is dark blue at the start of the injection, and the last areas to fill are red.
The following diagrams show the contour colors that represent the flow of plastic into the part. All regions with the same color are filled simultaneously. The result is dark blue at the start of the injection, and the last areas to fill are red. If the part is a short shot, the section that did not fill has no color.
Using This Result
The flow pattern is balanced in a part with a good fill time result, which means the following:
• All flow paths finish at the same time and reach the edges of the model simultaneously. In the previous diagram, each flow path should end with red contours.
• The contours are evenly spaced and indicate the speed at which the polymer is flowing. Widely-spaced contours indicate rapid flow; narrow contours indicate that the part is filling slowly.
Things To Look For
Short shot – On the Fill time result, a short shot will appear as translucent. Check the ends of the flow paths for any translucent areas.
Hesitation – If a Fill time result shows a section where the contours are very closely spaced, hesitation may have occurred. Hesitation can cause a short shot if a thin section freezes off before the part is completely filled.
Overpacking – If a Fill time result shows that one flow path finishes before others do, it may indicate overpacking. Overpacking can cause high part weight, warpage, and non-uniform density distribution throughout the part.
Weld lines – Overlay the Weld line result on the Fill time result to confirm their presence. Weld lines can cause structural and visual defects.
Air traps – Overlay the Air trap result on the Fill time result to confirm their presence. Air traps can cause structural and visual defects.
Racetrack effect – The racetrack effect can cause air traps and weld lines. Check the location and number of air traps and weld lines.
Confidence of Fill
The Confidence of fill result displays the probability of plastic filling a region within the cavity under conventional injection molding conditions. This result is derived from the pressure and temperature results.
Using This Result
The colors displayed in the Confidence of fill result indicate the following:
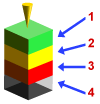
1. Will definitely fill.
2. May be difficult to fill or may have quality problems.
3. Will be difficult to fill or will have quality problems.
4. Will not fill and results in a short shot.
Confidence of Fill color codes
If the Confidence of fill result shows that your part will have medium or low confidence of fill, use the Results Adviser dialog to open the relevant Help topic and find out how to fix the problem.
Things To Look For
If the cavity does not fill and results in a short shot, changes must be made to the design, injection location, choice of plastic, or processing conditions. To ensure the finished part is of good quality, the cavity must also be adequately packed with plastic. You must therefore determine not only whether the part will fill, but also whether a good quality part can be made.
NOTE: Sometimes the Confidence of fill result does not predict a short shot, but still states that a good quality part cannot be molded. This is because the conditions at the end of the filling phase are not suitable for the part to be adequately packed during the packing phase.
When determining whether a good quality part can be molded, consider which colors are visible and how much of each color appears. You should also look at the Quality Prediction result.
The Adviser uses these two items of information to calculate the risks of producing this part on the following sliding scale:
All green – The part is easily filled and part quality should be acceptable.
Some yellow – The part may be difficult to mold or quality may not be acceptable. As the percentage of yellow increases, the difficulty in molding the part will increase and the part quality will decrease.
Some yellow and red – The part will be extremely difficult to fill or quality is more likely to be unacceptable. As the percentages of yellow and red increase, the difficulty in molding the part will increase and the part quality will decrease.
Any translucent – The part cannot be molded because a short shot will occur.
Quality Prediction
The Quality prediction result is used to estimate the quality of the mechanical properties and appearance of the part. This result is derived from the pressure, temperature, and other results.
The colors displayed in the Quality prediction result indicate the following:
1. Will have high quality.
2. May have quality problems.
3. Will definitely have quality problems.
Quality prediction color code (above). The Quality prediction result will not be available if there is a short shot. Fix the cause of the short shot before analyzing this result.
Using This Result
Check the Confidence of fill result to see how likely it is that the part will fill. If the Quality prediction result shows that your part will have medium or low quality, use the Results Adviser dialog to open the relevant Help topic and find out how to fix the problem.
NOTE: You can select which colors to display.
Things To Look For
The quality prediction of this part is displayed on the following sliding scale.
All green – The part quality should be acceptable.
Some yellow – The part quality may not be acceptable. As the percentage of yellow increases, the part quality will decrease.
Some yellow and red – The part quality is more likely to be unacceptable. As the percentages of yellow and red increase, the part quality will decrease.
Orientation at Skin
The Orientation at skin result provides a good indication of how molecules will be oriented on the outside of the part, showing the average principal alignment direction for the whole local area at the end of filling. Because the melt freezes very quickly when it contacts the mold for the first time, the velocity vector provides the most probable molecular orientation at the skin. The magnitudes of these vectors are normalized to one and are displayed multiplied by the given scale factor. Skin orientation is determined by the velocity direction when the melt front first reaches a given location.
Using This Result
The Orientation at skin result is useful for estimating the mechanical properties of a part. For example, the impact strength is typically much higher in the direction of molecular orientation at the skin. When using fiber-filled polymers, the tensile strength is also higher in the direction of orientation at the skin because the fibers on the surface are aligned in that direction. The skin orientation generally represents the direction of strength. For plastic parts that must withstand high impact or force, the gate location can be designed to give a skin orientation in the direction of the impact or force.
The linear shrinkage of a part also depends on the skin orientation. For unfilled polymers, the shrinkage in the direction of the skin or flow orientation is greater than in the direction of the core or transverse orientation. This situation may be reversed when using fiber-filled polymers due to the low shrinkage and stiffness of the fibers in the direction of skin orientation.
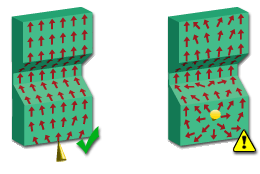
Compare the Orientation at skin result with the Fill time result to identify unbalanced flows in the part. It is important to orientate the molecules correctly to ensure the mechanical quality of a hinge. The injection locations must be placed in positions that produce a consistent molecular orientation, as shown in the following diagram on the left. The diagram on the right shows inconsistent molecular orientation, which leads to lower part quality.
Things To Look For
When viewing the Orientation at skin result, watch for the following:
• Unbalanced flow
• Inconsistent orientation
Average Temperature
The Average temperature result shows the average bulk temperature through the thickness of the part at the end of fill. The temperature of polymer melt changes not only with time and location, but also with thickness during the entire injection molding cycle. It is difficult to illustrate all these changes in a single display. Instead, the average temperature is used to indicate its weight across the thickness. Average temperature represents the energy that is transported through a particular location at a specific time. Hot spots, which are due to excessive viscous heating during the filling stage, are indicated on the average temperature contour.
Using This Result
You can use the Average temperature result as an alternate way of examining the flow distribution. Areas with continuous flow (heat convection) typically have a higher Average temperature, which drops quickly when the flow in that area stops. If the Average temperature is too low in a thin area of the part, hesitation or short shots can occur. If the Average temperature is too low in an area where weld lines are present, the weld lines may be worse.
In areas where the Average temperature is too high, material degradation and surface defects may occur. To alleviate this, make sure the Average temperature is always within the recommended temperature range for the polymer you are using. You may also consider redesigning the part geometry near the hot spot or changing the process conditions. Differential temperature can also cause non-uniform shrinkage and warpage.
The Average temperature result should be examined in conjuction with the Frozen layer fraction at end of fill result. Any section of the mold with an average temperature that is below the material transition temperature, and a frozen percentage of greater than 25 percent may not be packed properly, which can lead to shrinkage and warpage problems.
Things To Look For
A number of options are available to improve this result. Alterations usually have side effects so after making changes, you should check to see whether other problems have been caused.
Temperature too low – Increase the melt temperature, increase mold temperature, decrease injection time, increase the thickness in the area to permit flow for hesitation in thin areas, or move the gate away from the hesitation area.
Temperature too high – Increase the injection time which may increase cycle time.
Air Traps
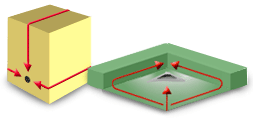
An air trap occurs where the melt traps and compresses a bubble of air or gas between two or more converging flow fronts, or between the flow front and the cavity wall. Typically, the result is a small hole or a blemish on the surface of the part. In extreme cases, the compression increases the temperature to a level that causes the plastic to degrade or burn. Air traps are often due to converging flow fronts caused by racetrack or hesitation effects, or by non-uniform or non-linear fill patterns. Even when the part has balanced flow paths, inadequate venting can cause air traps to occur at the ends of flow paths. For a Dual Domain model, the Air traps result shows a thin, continuous line wherever an air trap is likely to occur. For 3D models, it displays a solid colored area wherever an air trap is likely to occur.
Using This Result
The Air traps result shows how severe air traps will be and where they are likely to occur on the part. Air traps may be acceptable if they occur on a surface that does not have to be visually perfect. The Fill time result is used in conjunction with the Air traps result to confirm the filling behavior and assess the likelihood of air traps appearing.
The air trap plot is used to determine the probability of an air trap occurring at a particular location. A higher value indicates a higher probability that an air trap will occur, and a lower value indicates a lower probability that an air trap will occur.
The Air traps result can reveal the following problems in your part:
• Burn marks caused by air in an air trap, which ignites under pressure and burns the plastic.
• Short shots caused by the incomplete filling of the part; if an air trap is not vented and not compressed quickly enough to cause a burn mark, it may cause a short shot or leave bubbles of air or gas in the plastic part.
• Other surface blemishes caused by air traps.
Things To Look For
The following methods can be used to prevent air traps:
• Use flow leaders or deflectors.
• Increase the injection speed to eliminate air traps caused by converging flow fronts and hesitation.
• Decrease the injection speed to reduce air traps caused by poor venting, and to prevent burn marks.
• Decrease the part wall thickness ratio to reduce racetracking.
• Move the injection locations so that the air traps form in areas that are easy to vent, such as the parting plane.
Weld Lines
The Weld lines result displays the angle of convergence as two flow fronts meet. The presence of weld lines may indicate a structural weakness and/or a surface blemish. By overlaying the Fill time result and stepping through the animation, you can see how the flow fronts converge. The term “weld line” is often used to mean both weld and meld lines. The only difference between them is the angle at which they are formed; weld lines form at lower angles than meld lines. Weld lines can cause structural problems and make the part visually unacceptable, but they are unavoidable when the flow front splits and comes together around a hole, or if the part has multiple gates.
Consider the processing conditions and position of the weld lines to determine whether the weld lines will be high quality. Weld and meld lines should be avoided, particularly weld lines in areas that require strength or a smooth appearance. Processing conditions help to determine the quality of weld or meld lines. Weld line strength is influenced by the temperature at which the weld line is formed and the pressure exerted on the weld until the part freezes; pressure is 0 at the weld line. Typically a “good” weld will occur if the temperature of the melt at the weld line as it forms is no more than 20°C below the injection temperature.
Using This Result
Weld lines can be moved by changing the fill pattern to make the flow fronts meet at a different place. To move weld lines:
• Alter the gate locations.
• Change the thickness of the part.
To improve the quality of weld lines:
• Increase the melt temperature, injection speed, or packing pressure. This will enable the flow fronts to weld to each other more effectively.
• Increase the diameters of gates and runners to make it easier to pack the part.
• Move injection locations to make weld lines form closer to the gates. The weld line is then created with a higher flow front temperature and is packed with more pressure.
• Move injection locations to make flow fronts meet more obliquely, turning the weld line into a meld line.
• Optimize the design of the runner system.
• Reduce runner dimensions and maintain the same flow rate. Shear heating can then be utilized to increase the melt temperature at the flow front.
Solving one problem can introduce other problems to the injection molding process. Carefully consider all the relevant aspects of the mold design specification before choosing an option.
Things To Look For
The Weld Lines result helps you identify the following problems:
• Structural problems: The part may be more likely to fracture or deform at a weld line, especially if the weld line is of a low quality. This weakness is a more serious problem in areas of the part that are subject to stress.
• Visual defects: A weld line can cause a line, notch, or color change on the surface of the part. If the weld line is positioned on a non-critical part surface, such as the bottom, this may not be a problem.
Sink Marks Estimate
The Sink marks estimate and Sink marks shaded results display simulated sink marks on the part. These are two different visual interpretations of the same result. The Sink marks estimate result displays the calculated depths of sink marks in the part and provides a legend to interpret the depth differences. The Sink marks shaded result displays the sink marks on the model to represent how the part will actually look, as shown in the following diagram.
These sink mark results indicate the presence and location of sink marks and voids likely to be caused by features on the opposite face of the surface. Sink marks typically occur in moldings with thicker sections, or at locations opposite ribs, bosses, or internal fillets. These results do not indicate sink marks caused by locally thick regions. Although the result cannot predict whether a sink mark or a void has occurred, sink marks are the more likely option.
Using This Result
Because sink marks are a visual defect rather than a structural defect, the result should be evaluated against the part’s visual design specifications. Lighter colors and textured surfaces tend to make sink marks less visible. Generally, if the thickness of the rib is less than or equal to 60 percent of the main wall section, there is not likely to be any significant sink marks. If it is not possible to remove or reduce a sink mark, you can conceal it. This can be done by adding a design feature, such as a series of serrations on the area where it occurs.
Things To Look For
The following solutions can reduce the occurrence of sink marks:
1. Alter the part design to avoid thick sections and reduce the thickness of any features that intersect with the main surface.
2. Relocate the gate to or near the problem areas. This enables these sections to be packed before the thinner sections between the gate and the problem areas freeze.
3. Increase the size of gates and runners to delay the gate freeze-off time. This enables more material to be packed into the cavity.
4. Decreasing the melt and mold temperature may be sufficient. Alternatively, a less viscous melt can be used.
Conclusion
Make mold flow analysis part of your due diligence and design process. Use mold flow analysis earlier in your design to understand the challenges your part may be facing when leveraging the injection molding process, or validate the manufacturability of your injection molded part. Being proactive and working with a technical engineer to validate your part’s production will only reduce guess-work in bringing your part to market in a timely manner and on schedule.
Interested in obtaining more advice? Reach a Technical Engineer at sales@xcentricmold.com, or call (586) 589-4636

